Major League Baseball Speeds into the Playoffs
Pitching and Hitting Velocities Impact The Race for the World Series
Although many people complain that the game of baseball “is soooo slow”, on the contrast, it can be argued that baseball is a game of speed. The flame throwing pitcher. A screaming line drive off the bat. And the blazing speed of a baserunner or outfielder.
And, these performance metrics of the game are getting faster.
Unleashing the Heat: Pitching and Throwing
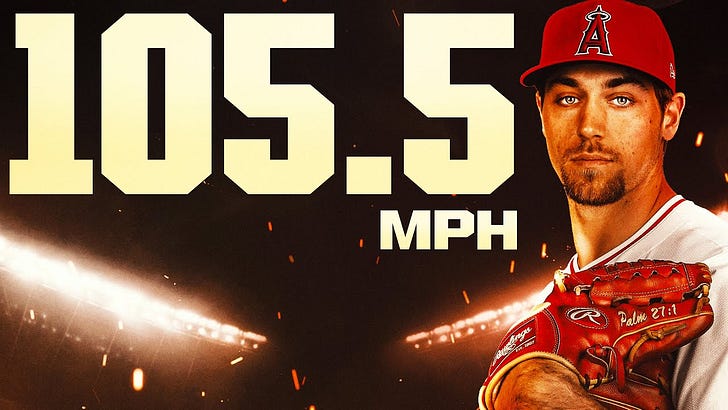
Much of the attention about speed in baseball has centered on the pitching mound, where the average MLB fastball speed has increased from around 89 mph in 2002 to 91.9 mph in 2008 to 94.2 mph in 2023. This year, five pitchers averaged - not just 1 or 2 pitches BUT averaged - 100+ mph with rookie Ben Joyce averaging 102.1 mph and hurling a 105.5 mph fastball on Sept 4 vs the LA Dodgers.
Besides the heat on the mound, position players are also topping the century mark with 16 outfielders throwing 100+ mph including Oneil Cruz who averaged 99.1 mph per throw. Shortstop Masyn Winn of the St Louis Cardinals also ripped a 101.2 mph throw across the infield this summer.
ICYMI: A list of 35 Scientific Review Papers on The Science of Throwing a Baseball
Laser Show: Barreling It Up
One can surmise that if the ball comes in faster from the pitcher, it will exit faster when hit. Ha, but that’s the key - when the baseball is hit. As pitching velocity has climbed over recent years (as discussed above), the league batting average has plummeted. In 2008, the MLB batting average was .264. From there, it has decreased to .248 this past season - as has the swing-and-miss percentage.
However, when solid contact is made (“barreling it up”), the MLB average batted ball exit velocity hits about 88.5 mph. There are 85 players with an average exit velo of 90+ mph with the NY Yankees Aaron Judge leading the way at 96.2 mph followed closely by the LA Dodgers Shohei Ohtani (95.8 mph). The hardest hit ball this season was by Oneil Cruz at 121.5 mph! (P.S. Ya, that same guy who threw it from the outfield at nearly 100 mph! And he can run too - average speed of 28.8 ft/s (19.6 mph) with 33 “Bolts” or runs >= 30.0 ft/sec)
Burning Up the Basepath
The data shown in this blog is from Statcast, a state-of-the-art tracking technology that allows for the collection and analysis of a massive amount of baseball data. Besides a vast array of hitting and pitching metrics, it also provides a Sprint Speed metric defined as feet per second in a player’s fastest one-second window on either: 1) runs of two bases or more on non-homers, excluding being a runner on second base when an extra base hit happens, or 2) home to first runs on “topped” or “weakly hit” balls.
The MLB average speed for a “competitive run” is 27 ft/sec (18.4 mph). The top speedsters average 30 ft/sec or 20.5 mph with six individuals hitting this mark and KC Royals Bobby Witt, Jr. topping it at 30.5 ft/sec. The graph below shows clear trends by position but also the individual variation within a position (i.e. some C and 1B are faster than some CF).
Extra Innings: A Few Final and Related Notes
A few current happenings inspired this post. First, over the past few months I have been reading ‘The MVP Machine: How Baseball’s New Nonconformists are using Data to Build Better Players’ by Ben Lindbergh and Travis Sawchik. This has been a great read on the evolution of technology, data analytics, and training methodologies (Rapsodo, Trackman, Driveline Baseline, etc.) into baseball to improve player development and player performance.
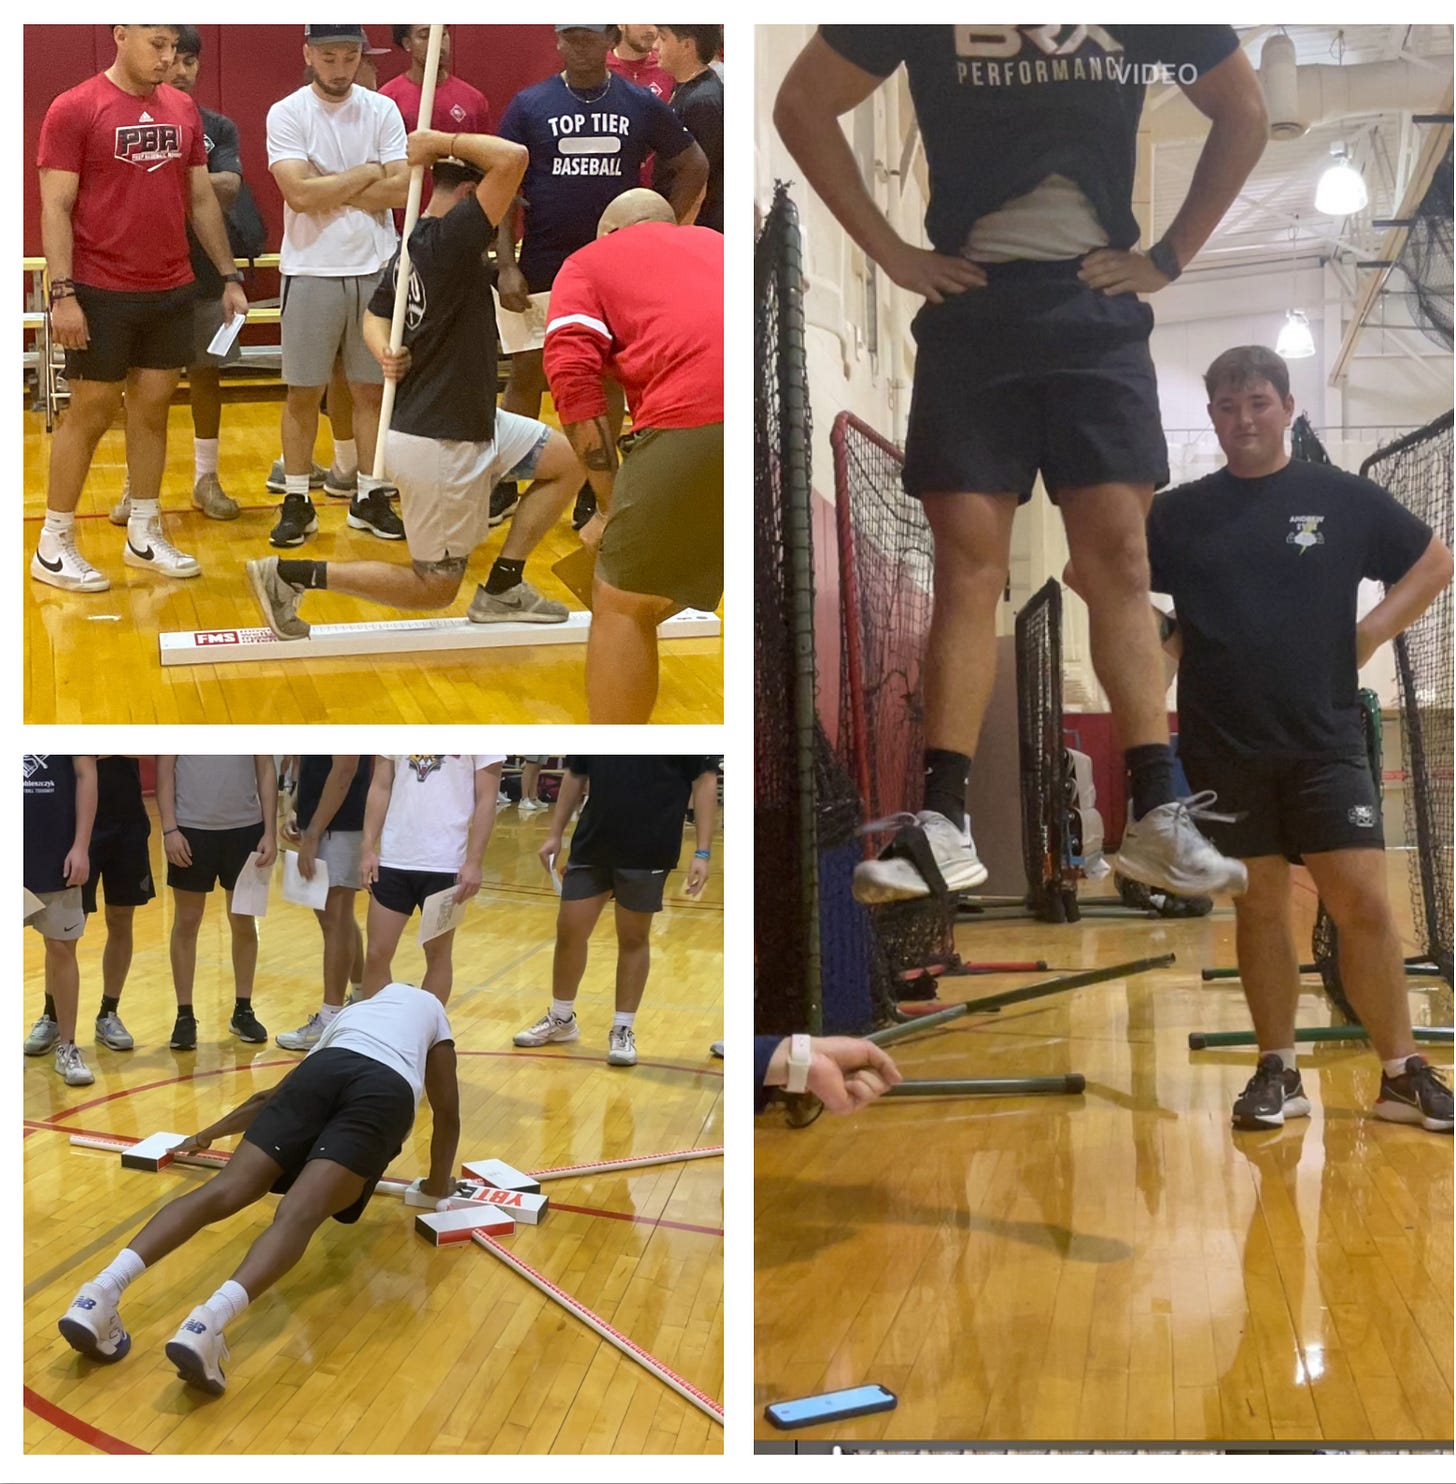
Second, life has come close to full circle for me. This past month our Sport Science team at Saint Xavier University in Chicago completed athlete profiling (speed, strength, power, etc) on the baseball team. It turns out the head coach had a turn coaching the American Legion team in Medicine Hat (Alberta, Canada) a few years after I coached there. My great friend and college baseball teammate, who still lives there, connected us and we have hit it off well. We are currently building player profiles to be used for off-season strength & conditioning and also examining relationships between off-field performance metrics and on-field pitching, throwing and hitting metrics. Besides providing sport science support, I’ve also be on-field leading dynamic warm-up, assisting with speed development applied to baserunning, and soon will be throwing batting practice. In 1993, this was my dream - a combo baseball performance coach and sport scientist. At the time, that was a novel idea and position. Now thirty years later, it is commonplace as discussed in the MVP Machine.
Enjoy the playoffs (MLB postseason schedule here).


