

Chasing Velo: A Preliminary Analysis of Age- and Maturity-based Modeling of Fastball Velocity during Adolescence in 25 MLB Pitchers

JC Eisenmann. A Preliminary Analysis of Age- and Maturity-based Modeling of Fastball Velocity during Adolescence in 25 MLB Pitchers. Archives of IronMan Performance. Vol 1, 2026. [joeeisenman.substack.com]
Introduction
Fastball velocity is one of the most highly valued performance characteristics among baseball pitchers. And over the past decade or so, the average MLB fastball has increased to roughly 94-95 mph. Current MLB superstar Jacob Misiorowski averages 100 mph, topping out at 105 mph!
This rise in velo also had downstream effects in youth pitching development, as it is strongly associated with advancement through the competitive levels of the sport. Pitchers who throw harder are more likely to be recruited, drafted, and ultimately compete at the professional level. As a result, increasing fastball velocity has become a primary objective for many adolescent pitchers, coaches, and player development programs.
It is said that “success leaves clues”. One way to gauge the development of promising pitchers is to examine the trajectories of MLB pitchers starting in their youth. Such trajectories can provide valuable benchmarks for pitcher development and facilitate more informed evaluations of performance progression.
In this paper, we describe the developmental trajectory of fastball velocity during adolescence among a sample of MLB pitchers using historical data.
Methods
Data were gathered on 25 MLB pitchers from the websites of Perfect Game, a baseball scouting service (observation date, height, weight and fastball velocity); Baseball-Reference.com, a baseball statistics database (date of birth, current height and weight); and Baseball Savant, a baseball analytics platform (current fastball velocity). All data were publicly available. Although several individuals were searched, only those with suitable longitudinal data covering several ages were considered herein. There were 4 to 9 observations per pitcher for a grand total of 154 observations across the 25 pitchers.
Data were managed and analyzed in Google Sheets. This included the calculation of chronological age [(Observation date minus DOB)/365], growth rates (expressed in units per yr, e.g. inches per yr) and the percent (%) of adult height. The % adult height has become a common proxy for maturity status. Note: the average age of peak height velocity (PHV) of boys is about 14 yrs. A common guide for an average maturer is as follows: pre-growth spurt (%PAH <85%); take-off/early phase of growth spurt; pre-PHV (85-89%); mid-late growth spurt (89-95%); and post-growth spurt (>95%); however, this scheme is slightly shifted to the left or right for the early and late maturer.
To characterize the developmental trajectory of fastball velocity, the data were fit using the model (i.e. linear, polynomial, exponential, etc.) that provided the best overall fit.
Results
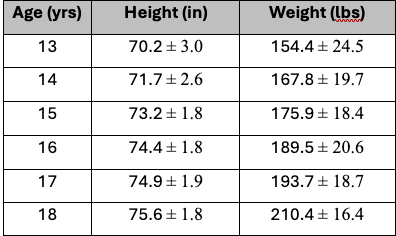
The average (SD) values for height and weight by age for the sample are shown in Table 1.
Fastball Velocity by Chronological Age
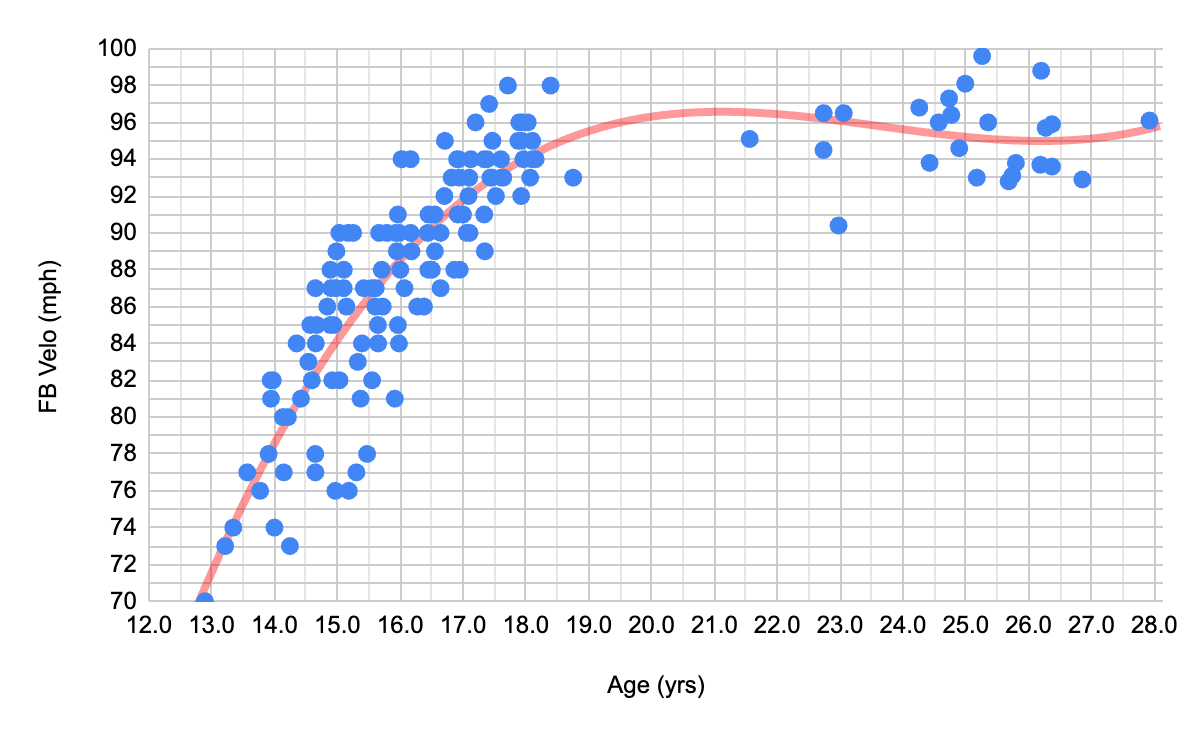
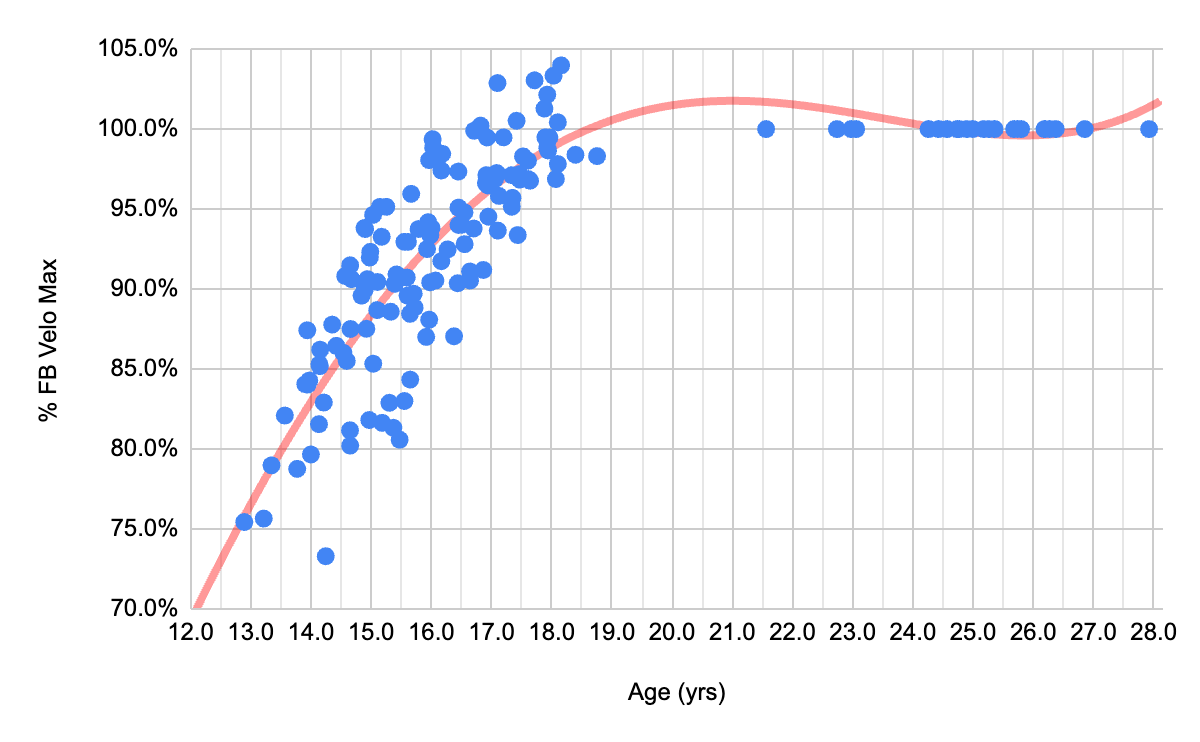
As expected, there is an increase in fastball velocity with age with peak velocity occurring around the age of 18-20 years - and earlier in some cases.
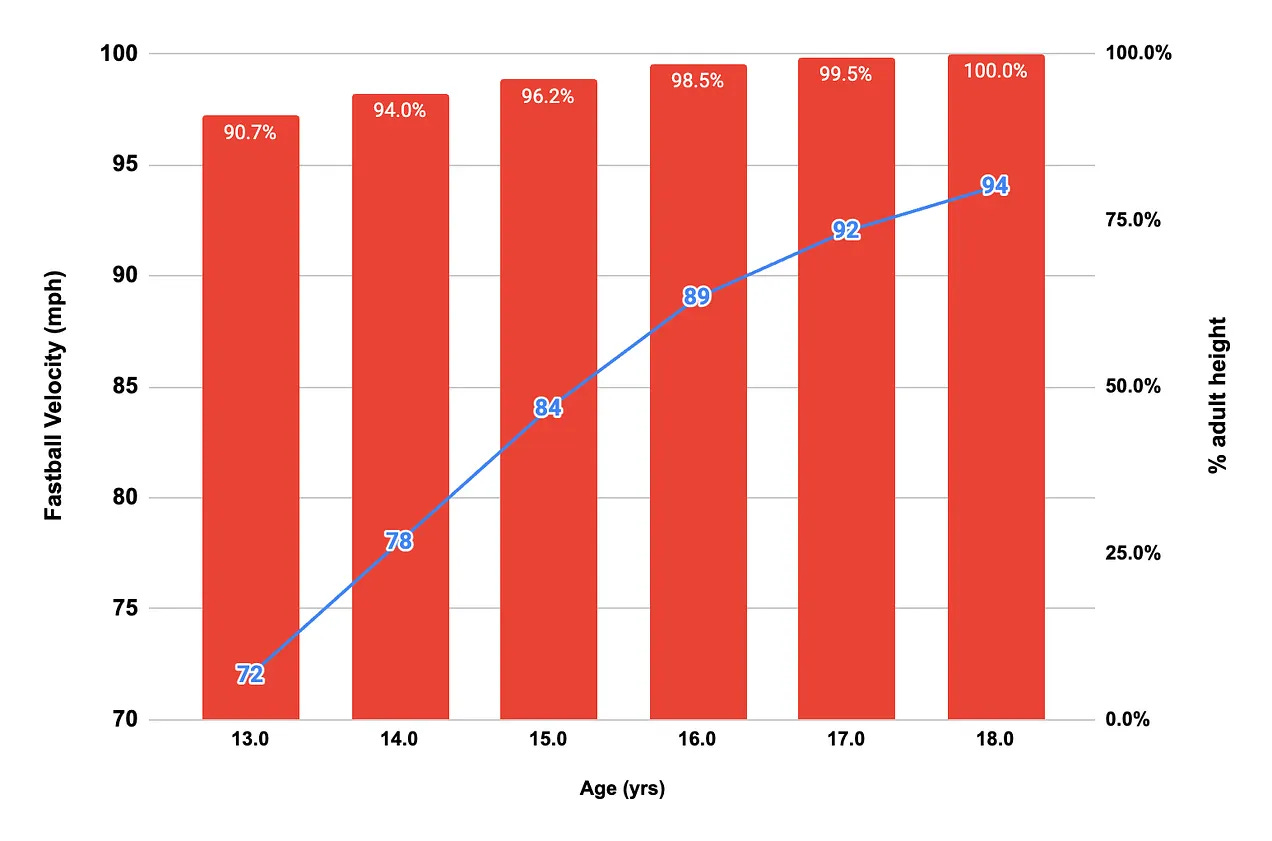
On average, fastball velocity increased 6 mph from age 13.0 (72 mph) to 14.0 (78 mph) and also from 14.0 to 15.0 yrs (84 mph), and then another 5 mph from 84 to 89 from 15.0 to 16.0 yrs. Thereafter, there was less annual gain, going from 89 to 92 mph between 16.0 and 17.0 yrs and reaching 94 mph at age 18.0 yrs (top panel). Some pitchers reached 90 mph at the age of 15-16 yrs.
At roughly ages 13.5 yrs and 15.4 yrs of age, 80% and 90%, respectively, of peak fastball velocity is attained (bottom panel). Several pitchers reached 100% peak fastball velocity around the age of 17-18 years, with some throwing harder at these ages than currently in MLB.
Fastball Velocity by Maturity Status (% Adult Height)
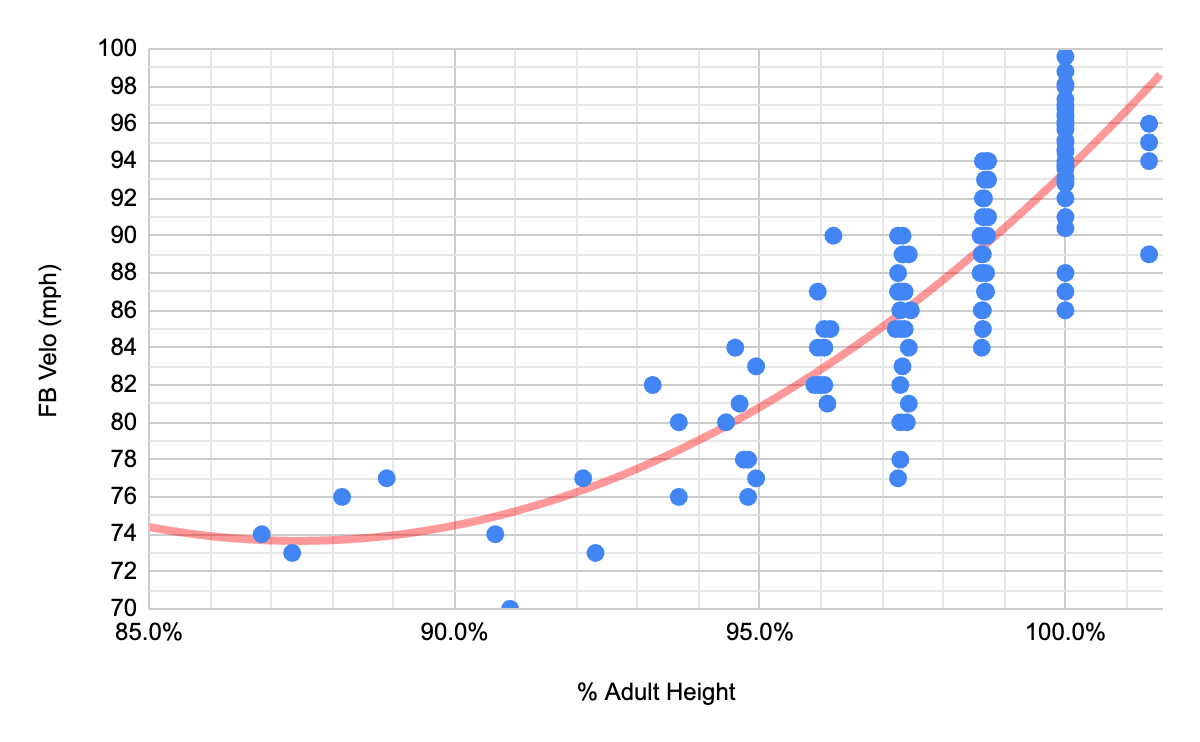
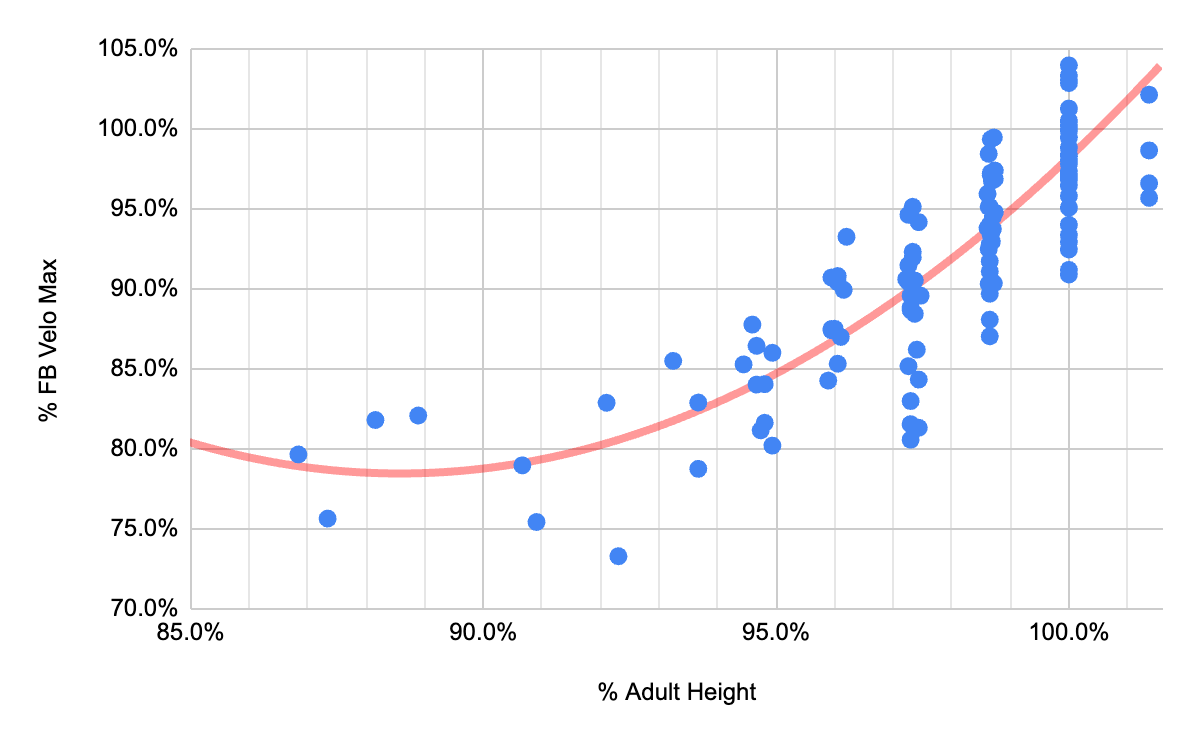
Although data is very limited, there appears to be no gain in fastball velocity between 85% and 91% adult height, which often represents the early-to-mid phase of the adolescent growth spurt (top panel). This phase also shows that fastball velocity is about 80% of peak values (bottom panel).
The maturity status at which 90% of peak fastball velocity is attained is approximately 97% of adult height. However, there is considerable individual variability as well representing continued gains during collegiate and/or minor league baseball (bottom panel).
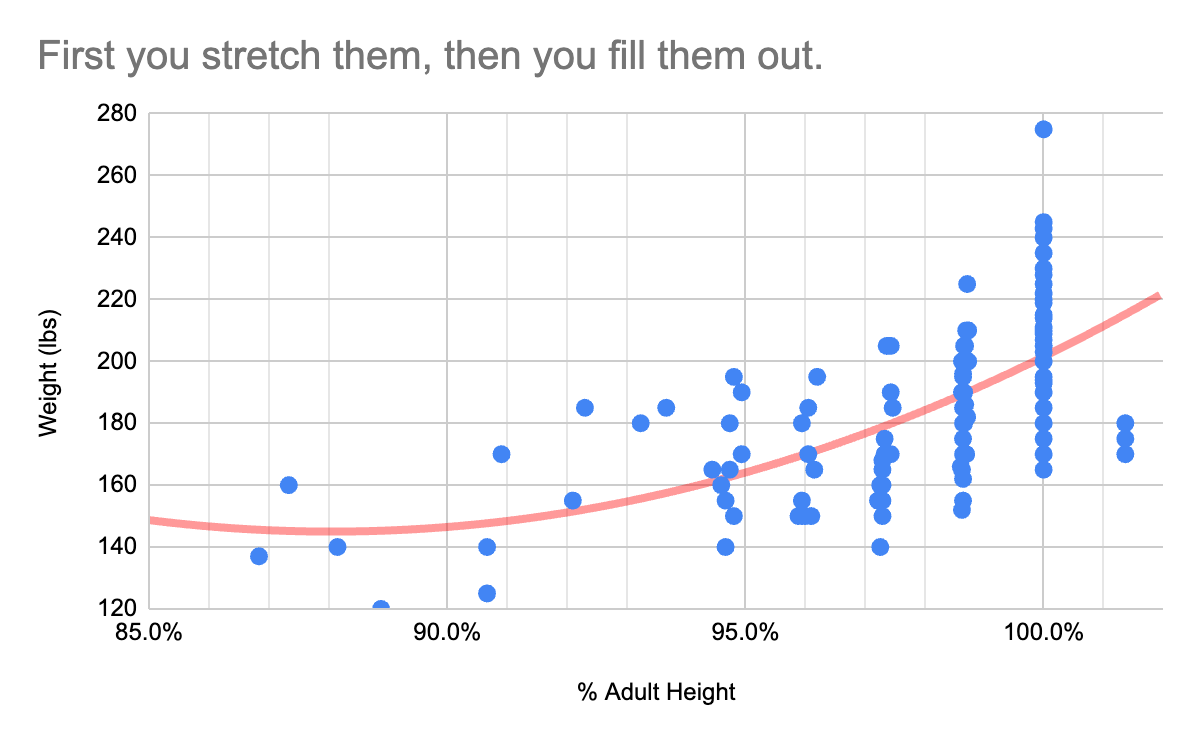
Following PHV (approximately 88-91% in this sample), there are significant gains in fastball velocity, especially starting at 95% of adult height. This generally coincides with peak weight velocity and significant increases in lean body mass (i.e., muscle mass), neuromuscular strength, and improved coordination and pitching biomechanics.
The following figure shows the increase in body weight post-PHV, or as Dr. James Tanner, pediatrician and human growth and maturation pioneering researcher said “first you stretch them, then you fill them out”. Meaning, first they grow in height, and then in weight.
The following figure is a composite of the age- and maturity-variation in fastball velocity of the sample of MLB pitchers (n=25). For reference, the age of PHV is generally attained about 91% adult height at the age of 14.0 yrs. As shown here, this sample is a full year ahead and thus most are characterized as early maturers.
Summary of Key Findings
This dataset represents a sample of MLB pitchers, and their age- and maturity-specific averages for fastball velocity during adolescence.
In general, these athletes are tall/big, early maturing boys.
There are large gains in fastball velocity post-PHV / late adolescence as males generally show a large increase in lean body mass and skeletal muscle mass. In addition, there could also be related to changes in muscular strength and power along with refinements and mastery of motor skill acquisition and biomechanics.
Further study is needed on the changes in fastball velocity during circa-PHV (at or around PHV). The limited data shown here, and in other case studies, indicates a decrease in the rate of annual gain or no change in fastball velocity. This may be due to the impact that rapid growth has on coordination and relative muscular strength.
Implications
Given the efforts in assessing performance metrics at these showcase/combine events, it is recommended that standardized procedures be used to measure height, weight and maturity status, given their impact on performance, and potentially injury risk, during adolescence.
Beyond performance, what remains to be determined is the impact of growth, maturation, and training load on the risk of injury to the throwing arm during adolescence. Given the significant increase in Tommy John surgeries in 15-19 year olds, now accounting for approximately 57% of all TJ surgeries performed, there is a need to systematically investigate the multi-factorial nature of this phenomena, including growth and maturation - as throwing load is already suspect. In an upcoming post, I will shed further light on ideas around this area of study.
How to cite this article: JC Eisenmann. A Preliminary Analysis of Age- and Maturity-based Modeling of Fastball Velocity during Adolescence in 25 MLB Pitchers. Archives of IronMan Performance. Vol 1, 2026. [joeeisenmann.substack.com]


☕️ Or if you don’t want to pay to subscribe, but ever feel like getting me a coffee ☕️ — you can! There is a cool site which allows people to ‘tip’ or get me a ’sip’ or cup of Joe! Click here: https://ko-fi.com/joeeisenmann