

Chasing Velo: Benchmarks for 13-18 Year Old Competitive Pitchers
Reference values for the 25th-50th-75th-90th Percentiles

JC Eisenmann. Chasing Velo: Benchmarks for 13-18 Year Old Competitive Pitchers. Archives of IronMan Performance. Vol 1, 2026.
Humans are fascinated by speed. The 100m dash in the Olympics. Formula One race cars. Thoroughbred horses.
And, the fastball.
No other time in Major League Baseball have we witnessed so many elite flamethrowers, night in and night out. For Pete’s sake, Jacob Misiorowski has an average fastball of 100 mph this season. In a game versus the Colorado Rockies, he threw 52 of his 98 pitches at 100-plus mph, and 45 pitches at 101-mph plus. And threw the fastest pitch by a starting pitcher at 103.7 mph. Only to top it in his next start at 105.0!!
In recent posts, I have shown the following figure of the modeled values for 25 MLB pitchers from age 13-18 years. [The full paper can be found here]
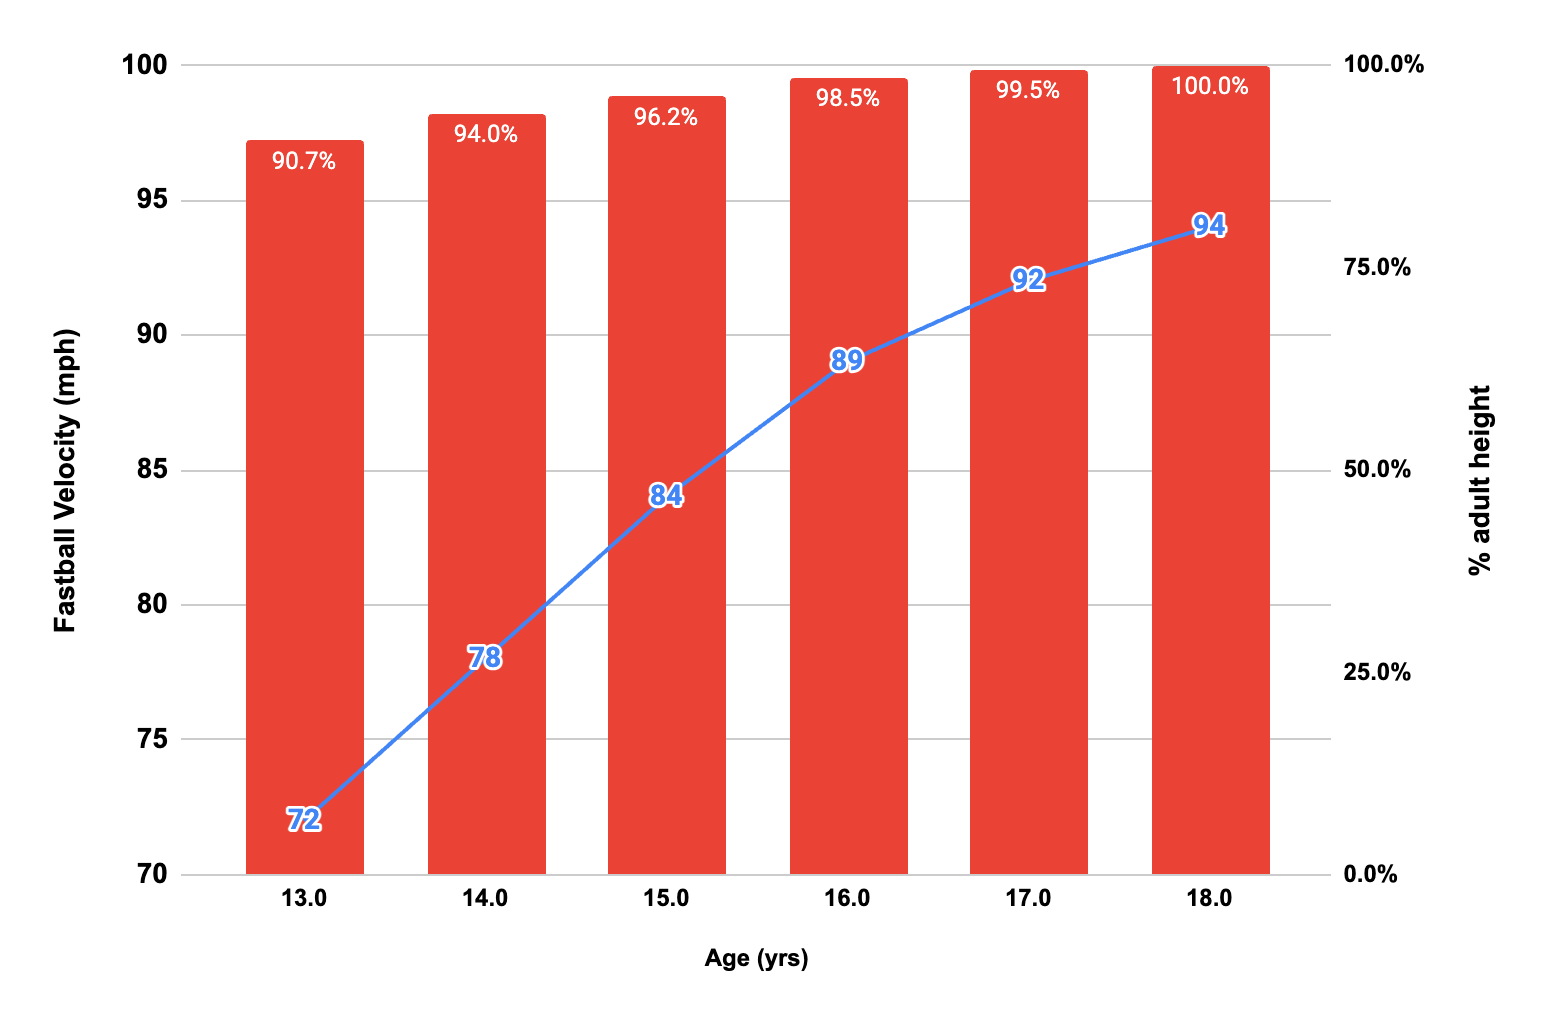
However, what are the general trends among adolescent pitchers? I frequently see parents/coaches (or kids) asking on message boards and/or social media (i.e.. Facebook, Reddit), “What is the average velocity for a 13 yr old in 7th grade?
Sometimes various websites and/or articles will show or mention “average” values. For example, I found this statement in an article by Gene Coleman, former strength & conditioning coach of the Houston Astros, “Average fastball velocity for 13-year old pitchers is 65 mph. Average for 14U pitchers is 70 mph”. Source? Not provided.
Thus, there is a bit of a hodge-podge of “normative” values for fastball velocity for youth and high school athletes. And, much of it includes suggestions or opinions on the web, with very little, if any, indication provided to how these benchmarks were determined.
Establishing age-specific reference values may provide valuable benchmarks for player development and facilitate more informed evaluations of performance progression. Thus, the purpose of this study was to develop normative age-related reference values in fastball velocity among competitive adolescent pitchers.
Methods
Data were gathered from a web scraping project of publicly available data from an independent scouting and event services for amateur baseball players using Gemini. Age-specific values were derived for the 25th, 50th, 75th and 90th percentiles. Ages are shown to the 0.5 yr to represent a “14 yr old” etc. Furthermore, we overlayed the age-specific fastball velocity of 25 current MLB pitchers based on statistical modeling from a related project.
Results and Key Findings
The following figure depicts the age-specific reference values - or benchmarks - of fastball velocity of 13-18 yr old (middle school to graduating seniors).
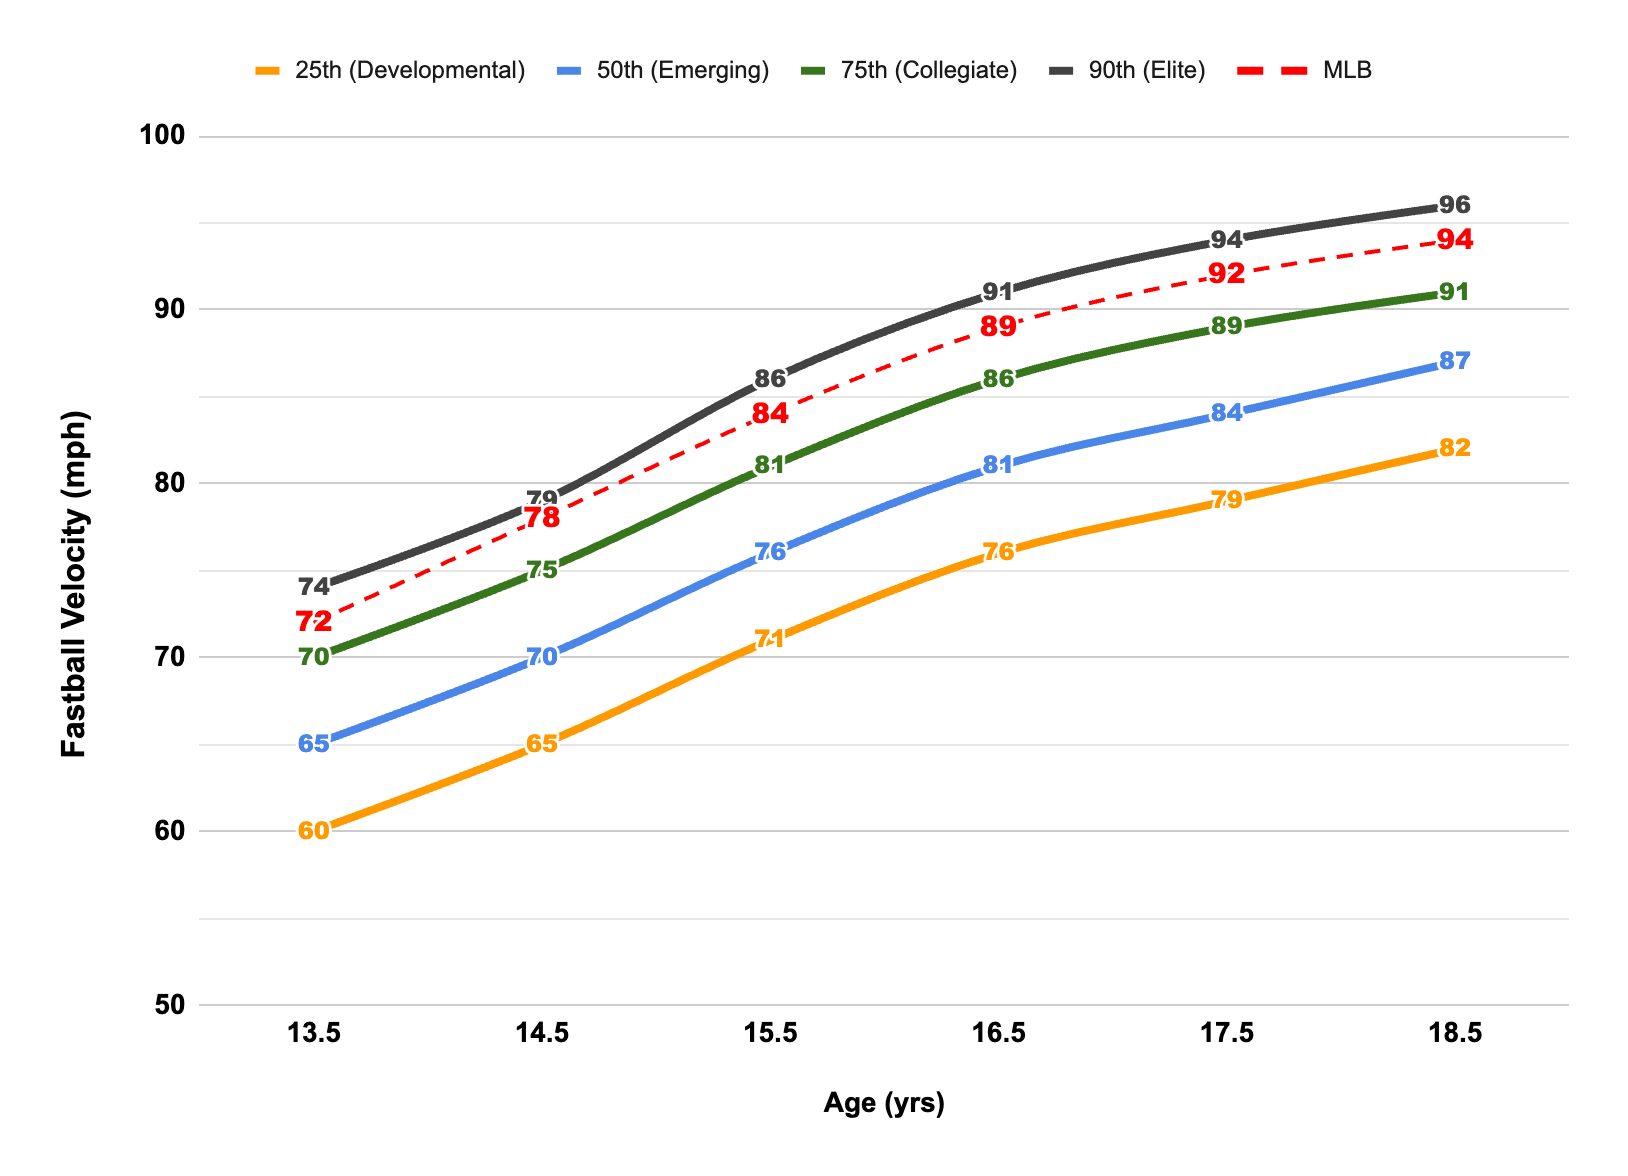
To begin, the 50th percentile should perhaps not be considered “average” given the general characteristics of the sample. Reference values always reflect the sample from which they were derived, and in this case, those attending the scouting/showcase events are typically highly competitive young athletes, often play on select teams. Thus, it may be recommended that the 25th percentile be considered as “average” but we refer to it as ‘Developmental’ here. In this case, we label the 50th percentile as ‘Emerging”.
Overall, there is a 4-5 mph difference between percentile bands within an age group. For example, within the 13 yr olds values, fastball velo is 60mph at the 25th percentile then goes to 65 mph at the 50th percentile then to 70 at the 75th percentile, etc.
In terms of age-related increases - if a pitcher tracks within a given percentile, there is an increase in fastball velocity of about 22 mph from the age of 13 to 18 years. For example, fastball velocity goes from 65 to 87 mph for those starting and staying at the 50th percentile. Furthermore, these yearly changes are about 5-6 mph from 13-16 years of age, and drop to 2-3 mph from 16-18 years of age.
The data from the MLB pitchers track closely to the 90th percentile (“elite”), which provides verification of this benchmark.
Considerations and Limitations
Let’s start with limitations. First, the data were gathered and analysed by Gemini. However, Gemini AI is a highly accurate tool for web scraping, with internal evaluations showing up to 98% accuracy in structuring web data.
Second, data are always impacted by methodological & testing procedures. For example, there may be equipment and/or user/tester discrepancies across sites and events. Performance metrics are highly sensitive to the technology used to capture them. For example, various radar guns may yield slightly different velocities.
Third, the percentiles are based on cross-sectional data, ignoring true individual longitudinal records. However, most reference values are derived using this study design. But related, individual patterns of growth (and performance) are impacted not only by chronological age but also biological age or maturity. Indeed, Standardized age-group norms assume a homogeneity that does not exist in adolescence. An early-maturing athlete may appear in the 90th percentile for their chronological age simply due to advanced biological development and then fall back into a lower percentile, while a late-maturer may begin in the 25th percentile despite having excellent foundational mechanics and eventually pass into the 50th percentile and above following the growth spurt.
Important: Read This! The annual gains in fastball velocity (about 5 mph per percentile band) should also give some perspective on the purported training gains among youth athletes stated by various coaches, programs, and products. Normal growth and maturation is very robust. I am not saying that training does not have an effect. It is just that this has been the pediatric exercise scientists dilemma for decades - how do you tease out the effects of training from those of normal growth and maturation? Listen, I have dedicated my entire academic career to this field, and cannot tell you the best research design and/or statistical modeling to fully answer that question.
Beyond the Fastball
While a high-velocity fastball is an asset for elite performance and scouting, relying on raw power alone is rarely enough to sustain long-term pitching success. Achieving elite radar gun outputs means very little if a pitcher lacks the mechanical efficiency, secondary pitches, control, holding runners on, etc. that are required to consistently navigate a batting lineup and play the game. Ultimately, pairing on-the-mound performance with functional movement quality and strength and recovery is what allows a young athlete to withstand the extreme mechanical stress of pitching (and training), maintain structural health, and remain injury-free.
Take Home Point
Fastball velocity has become a primary objective in the development of adolescent pitchers. This paper provides age-specific reference values or benchmarks for 13-18 year old U.S. baseball pitchers that can be used for talent identification, selection and/or development.
When implementing reference values and percentile norms in athletic development, sports science, or clinical practice, it is crucial to understand their inherent boundaries. Normative data is a powerful benchmarking tool, but it should never be treated as an absolute diagnostic or a rigid ceiling for athlete potential - especially during the dynamic phase of life called adolescence.
Practical Takeaway
Reference values or benchmarks should be used as a compass, not a GPS. They provide excellent context for baseline screening, talent evaluation, performance tracking, but they must always be layered over individual longitudinal tracking, physical growth and biological maturity assessments, and movement quality profiles.
How to cite: JC Eisenmann. Chasing Velo: Benchmarks for 13-18 Year Old Competitive Pitchers. Archives of IronMan Performance. Vol 1, 2026. [eisenmann.substack.com]
☕️ Or if you don’t want to pay to subscribe, but ever feel like getting me a coffee ☕️ — you can! There is a cool site which allows people to ‘tip’ or get me a ’sip’ or cup of Joe! Click here: https://ko-fi.com/joeeisenmann