

Performance Metrics for USA Baseball National Teams & Athlete Development Programs, 12U-Collegiate
Speed | Lower Body Power | Grip Strength

I remember opening the envelope from the United States Baseball Federation (now USA Baseball) in the late Fall or winter of 1987. Inside was a cover letter stating that I had been nominated for selection to the regional team as part of the tryout process for the USA Jr. National team. This process included completing a survey that included seasonal stats (batting average, HRs, etc.), honors and also performance metrics for home-to-first running time, bench press and squat 1RM, vertical jump etc.
I completed the survey and mailed it in, with the hopes of being invited to the tryout camp in Millington, Tennessee where selections would be made for the regional and national teams. I was not selected to attend the camp.

Today, the process for being selected to the national team is much, much different. No surveys or self-administered testing and reporting. Instead, USA Baseball, in collaboration with Major League Baseball (MLB), has established the Prospect Development Pipeline (PDP) as a player development pipeline leading to the MLB Draft for amateur baseball players in the United States.
This process begins at the 11U age level but players can enter at any age. For athletes interested in getting on the radar, USA Baseball uses three different identification events to select players for the Athlete Development Program (13U/14U and 16U/17U) and National Teams (12U, 15U, 18U and Collegiate). The Collegiate team is often composed of freshman and sophomores (18-20 years of age).
Athletes can be identified from 1) the National Team Identification Series (NTIS), 2) National Team Championships in Arizona and North Carolina, and 3) through recommendations from scouts and coaches in the amateur baseball community.
USA Baseball states that the “National Team Identification Series (NTIS) is the most comprehensive player identification program offered by USA Baseball”. Players from across the country will begin the identification process by participating in camps and tryouts at the regional level in one of six regions across the country. The program was initiated in 2009.
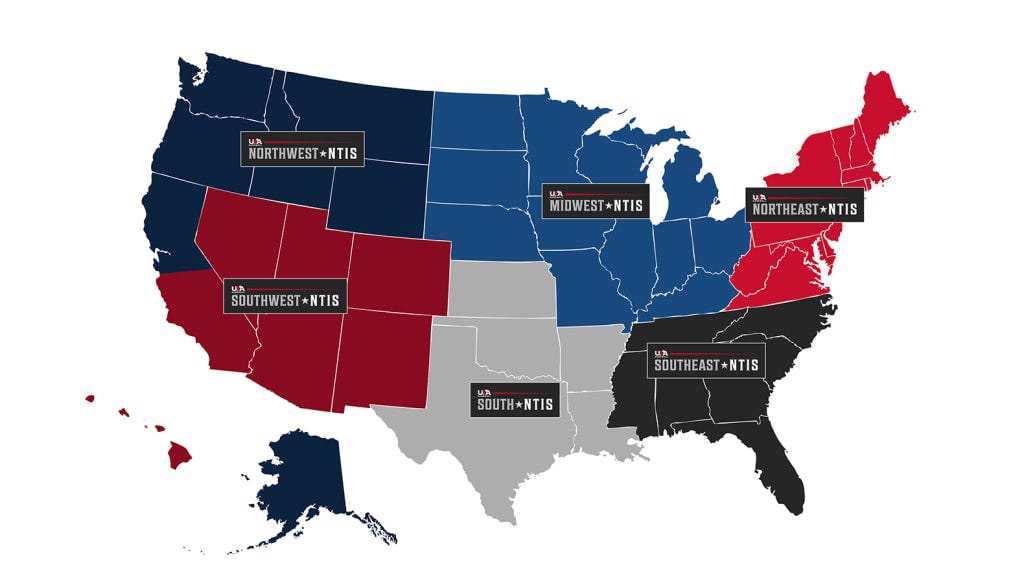
After camps and tryouts have been completed, each region will select athletes from each of the 11U, 12U and 13U age groups (n=16), and 18 athletes from each of the 14U, 15U and 16U age groups, to an All-Region team that will participate in the NTIS Champions Cup at the USA Baseball National Training Complex. Following the NTIS Champions Cup, USA Baseball will invite athletes from the NTIS Champions Cup event to the following year’s Athlete Development Program. Registration Fees (from Southwest Region): Regional Showcase round 1: $195; Regional Showcase round 2: $150; NTIS Champions Cup: $475
The Athlete Development Program consists of four days of training, education and competition at the USA Baseball national training center in Cary, NC. National teams will assemble for extended training camps prior to competing in international tournaments.
The USA Baseball National Team Championships are tournaments held in Arizona and North Carolina. More than 300 teams will be invited to showcase their talents against top programs and players from across the nation while being scouted for USA national teams and development programs.
PDP testing takes place at USA Baseball events.
Here’s one players journey through this process:
The purpose of this article is to share the publicly available average values from the PDP Performance Assessment used in conjunction with USA Baseball national team identification.
Assessment Methods and Average Values
The complete PDP Performance Assessment is spelled out here, and includes the following measurements: 30-yard sprint; countermovement jump (CMJ); broad jump; handgrip strength; height and weight; 2D drift protocol for dynamic stability, balance and single-leg power; Hawkeye assessment for cognitive processing; agility using man-in-the-box drill; performance vision; on-field pitching and hitting metrics.
The only publicly available data is for 30-yard sprint, CMJ, force plate metrics, and handgrip strength. As expected, all performance metrics increase across age groups. Here’s a closer look.
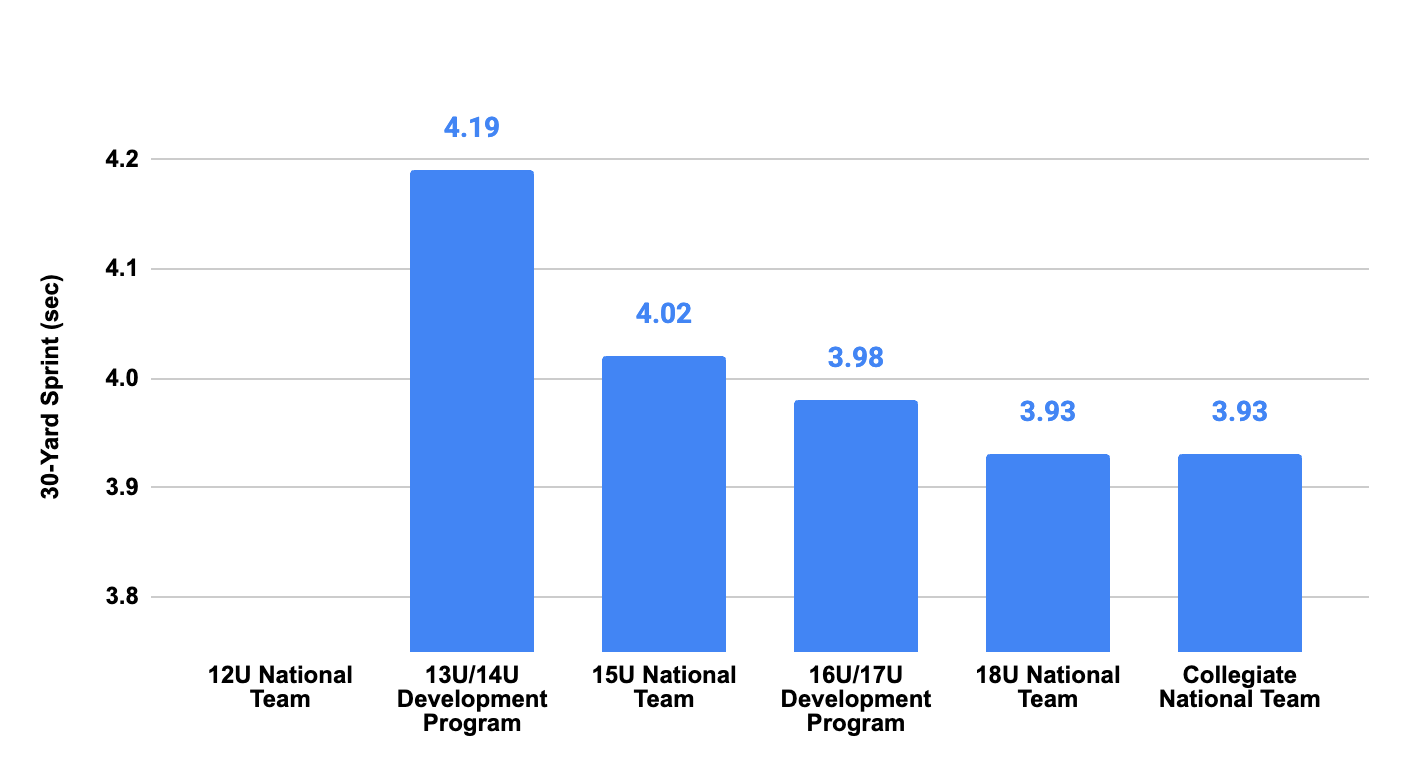
Sprinting Speed - 30-yard sprint: measured using electronic timing system (Witty). Note: 12U data is reported for a 25-yard sprint and not shown in the graph (mean = 3.93 seconds). There is a 4% (0.17 sec) improvement from the 13U/14U group to the 15U group; thereafter there is a 1% (0.04 sec) improvement between groups until no difference between the two oldest groups.
Vertical and Horizontal Lower Body Power - Broad Jump and CMJ: The broad jump is completed using the standard technique and measured with an optical sensing system (the Microgate Optojump). CMJ is measured three ways: a dynamic 3-jump using the Optojump; and two jumps using force plates (Vald ForceDecks) with arm swing and no arm swing. CMJ using the Optojump is shown here since data is available for the 12U team; plus we also show the absolute and relative peak power data for the force plate jumps (no arms) since this removes some coordination/technique issues and isolates lower body power. In addition, utilization of force plates is becoming more commonplace in athlete testing. However, force plate data is not available for the 12U team.
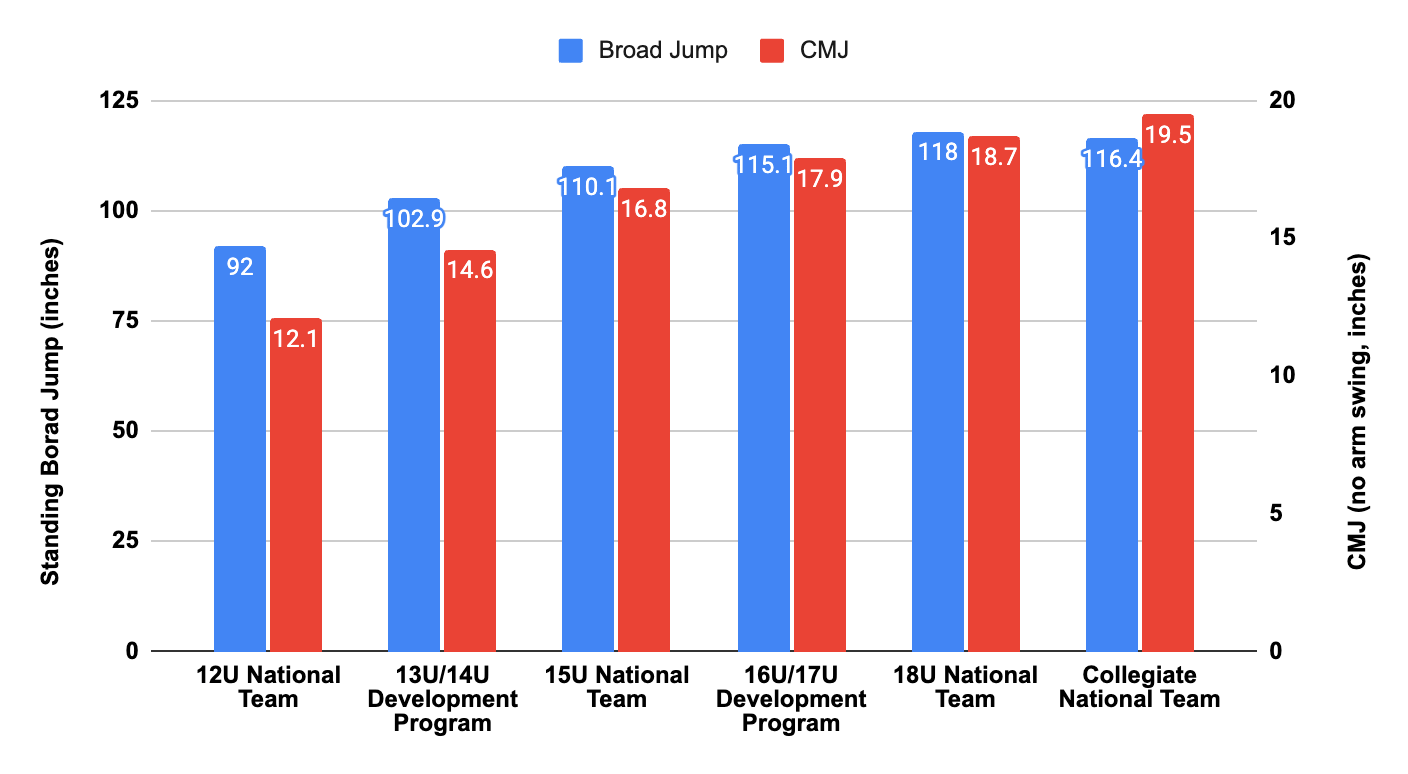
The increase in broad jump across groups from 12U to 16U/17U groups goes as follows: 12%, 7%, and 5% resulting in an increase of nearly 2 feet (23 inches). Thereafter, the values plateau.
For CMJ, the increase across groups from 12U to 16U/17U groups goes as follows: 21%, 15%, and 7% resulting in an increase of nearly 6 inches. Thereafter, the increase is 4% across last few groups.
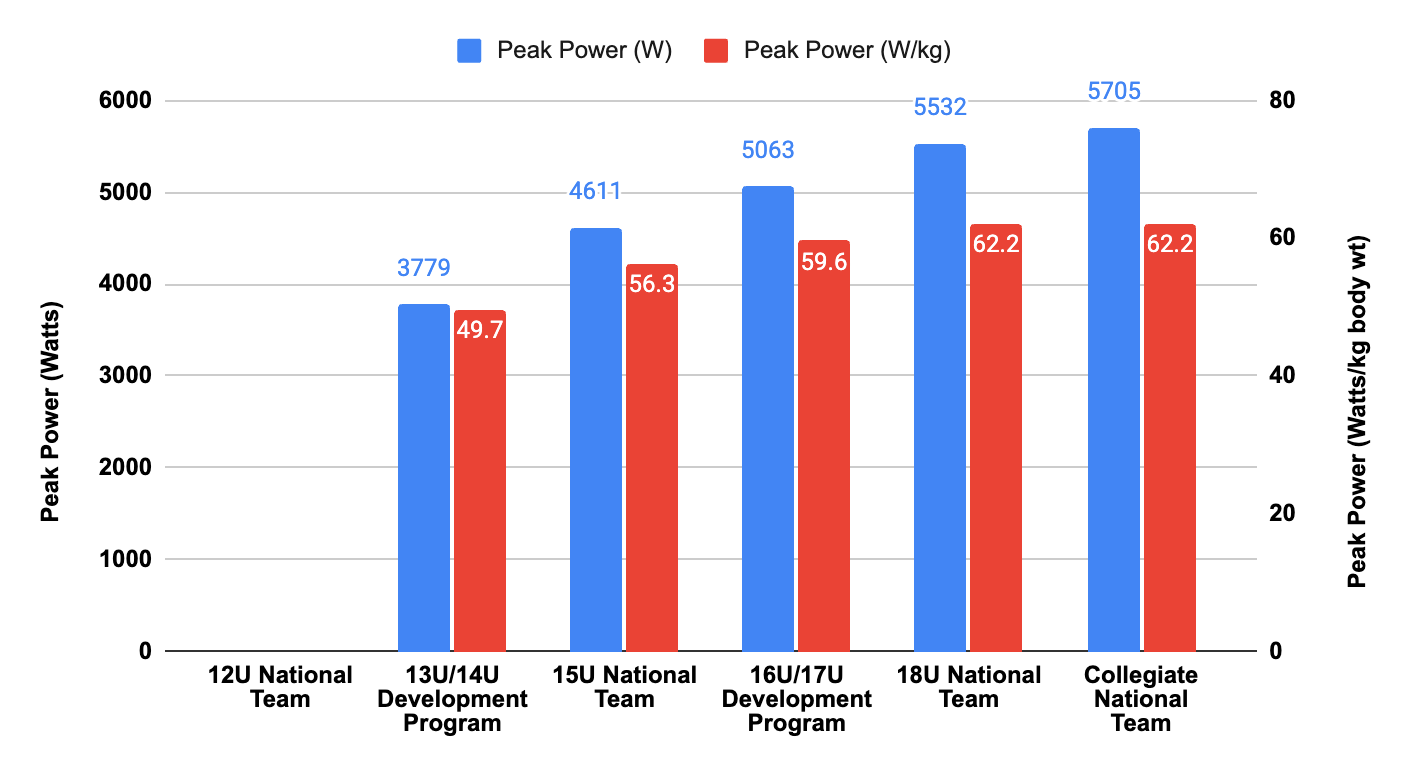
The increase in absolute peak power output (W) across groups from 13U/14U to Collegiate groups goes as follows: 22%, 10%, 9%, and 3% resulting in an increase of nearly 2000 Watts. Corresponding values for relative peak power (W/kg) 13%, 6%, 4% and 0%, going from 50 W/kg to 62 W/kg.
Isometric Handgrip Strength: Assessed using the Jamar dynamometer. Athletes perform the task in three different positions (arm straight down at the side, arm at 90-degree angle, arm straight up overhead) with each hand. Unfortunately, the dominant hand was not noted. Combined handgrip (right + left) was calculated here.
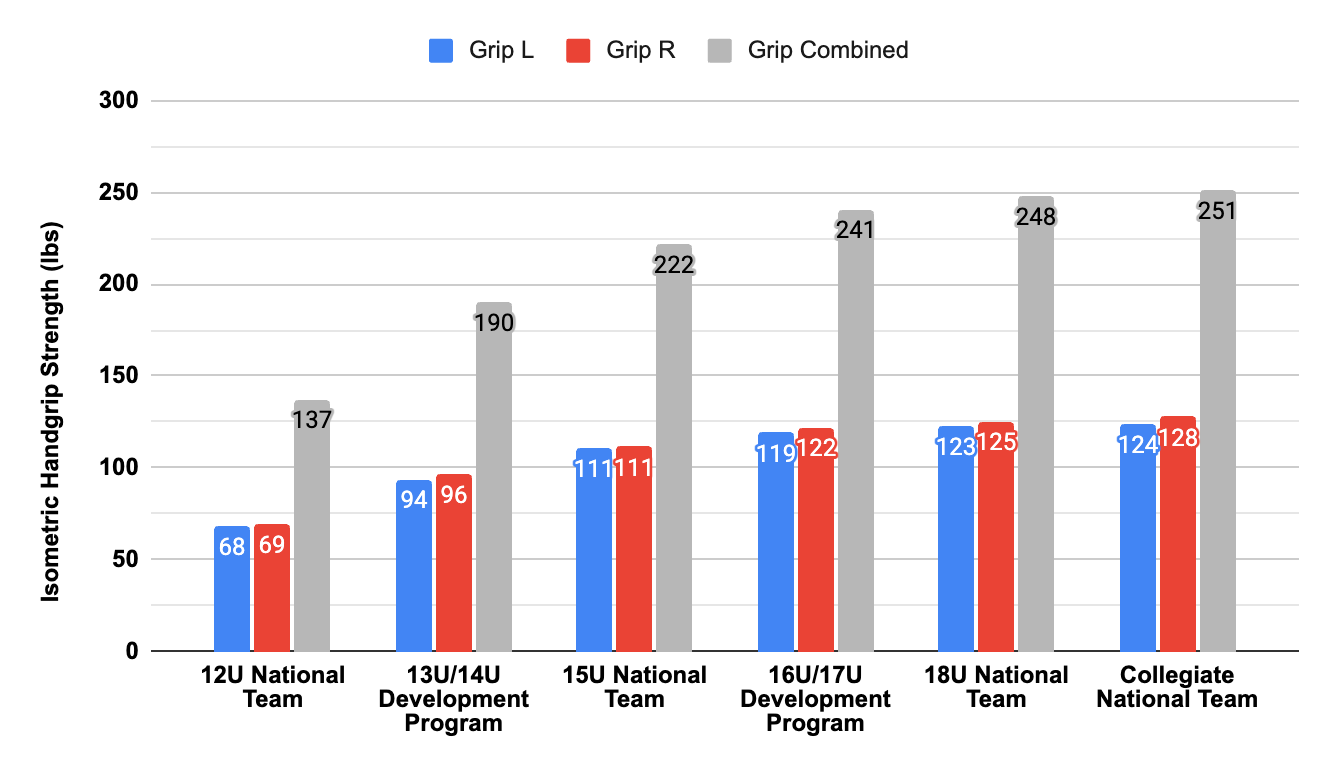
The increase in handgrip strength across groups from 12U to 16U/17U groups goes as follows: 38%, 17%, and 9%, going from about 70 lbs per hand to about 120 lbs - a 50 lb increase in force production. Thereafter, the values show only a small difference (1-3% increase) across the latter groups.
Body Size
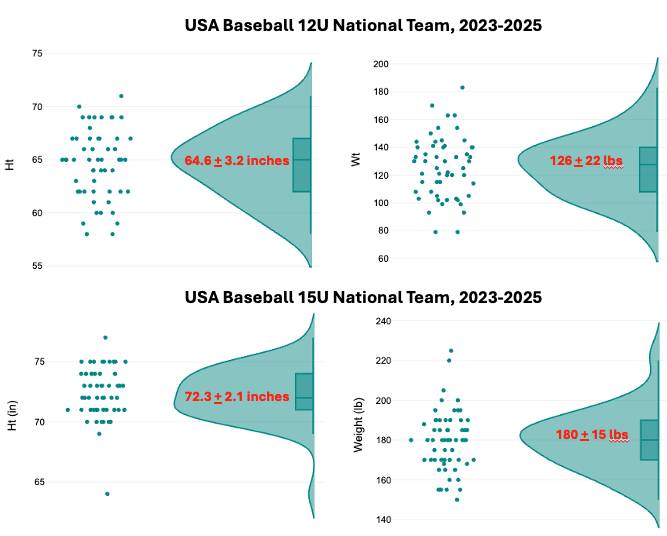
Body size (and body composition), especially during adolescence, is an important factor in performance metrics. Although the average height and weight of those completing the PDP assessments is not available, we offer the following data from the 2023-2025 12U and 15U National teams. For context, the 50th and 90th percentiles for height and weight of a 12.0 yr old boy are: 59 inches and 62.5 inches and 90 lbs and 118 lbs. For a 15.0 yr old boy, the corresponding values for height are 67 inches and 71 inches, and for weight are 124 lbs and 160 lbs.
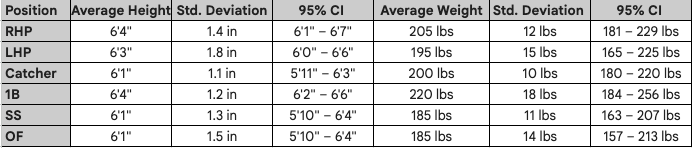
At the 18U and Collegiate level, we offer the following values by position derived from Perfect Game and Prep Baseball Report.
Comments
This report shows the average values for selected performance metrics made available from the USA Baseball PDP data & statistics website.
Although the dissemination of average values is important for comparison and development of young athletes, there are a few things to address.
First and foremost, providing only mean values is limited. Although mean values can assist in identifying and developing youth athletes, one must recognize the variability in body size and performance metrics. By focusing on ‘the tyranny of the Golden mean’, we lose sight or overlook the variation.
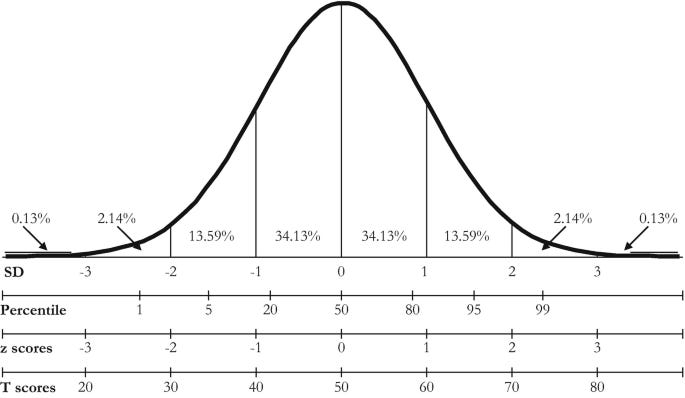
Including a measure of variance such as the standard deviation or 95% confidence intervals would enhance the comparison of individual values to the group mean. More specifically, it would allow for the calculation of standard scores such as the Z-score [=athlete score / mean)/SD] or T-score [=50 + 10*Z-score]. Additionally, percentiles (i.e. 25th, 33rd, 50th, etc.) would be a great addition for benchmarking and profiling. (Note: upper figure below provides how these statistics align with each other across a normal distribution of data.) In doing so, a comprehensive athlete profile could be created to allow for further insights into an athlete’s strengths and weaknesses and developmental trajectory (see second figure below showing athlete Z-scores, left and T-scores, right).
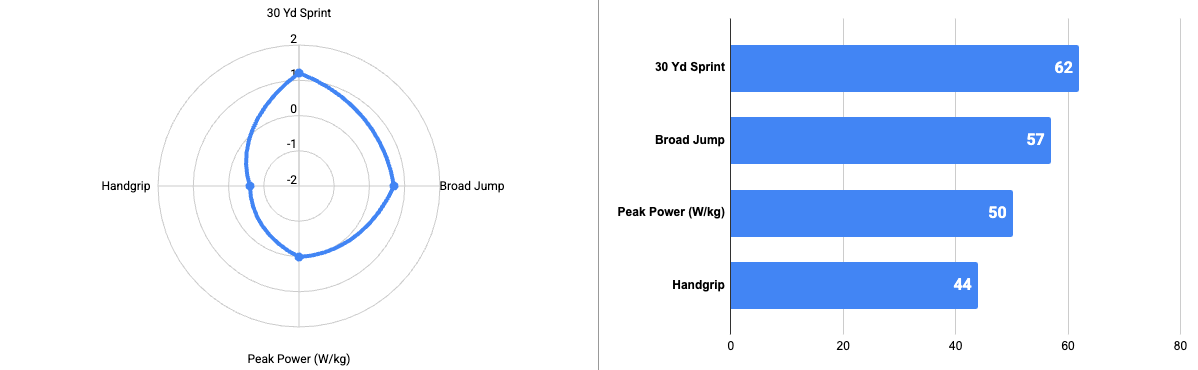
Second, the ability to access the data and collaborate with USA Baseball would be beneficial. Although there are three published papers led by LG Appelbaum (see below), they are rooted in advanced statistics (exploratory factor analysis and hierarchical regression) without much application for sports scientists, sports performance and sports medicine practitioners, coaches and athletes. For example, one key finding was that age, height, and weight accounted for 58% of the batted ball speed and 36% of fastball velocity. Of course it did … when you include 13-18 year olds in the same analysis!
If you are associated with USA Baseball and reading this article - I am interested in collaborating, I would be grateful if you contacted me.

Third, it is always easy to critique the choice of test selection. But considering just the performance metrics reported here, the test battery represents a simple-to-execute protocol for speed, lower body horizontal and vertical power, and handgrip strength. Even without force plate technology, one can access countermovement jump using other methods including contact (jump) mats that are becoming popular. Furthermore, peak power output can also be calculated from CMJ using the Sayers equation. And, even without laser timing systems, the 30-yard dash can also be assessed using hand-held devices. However, laser timing systems are certainly preferred for accuracy, and given that are also becoming more affordable and widely available it is suggested that a 10-yard time also be determined. This would allow further insights into training methods to improve either acceleration, maximal sprinting speed or both. Finally, although handgrip strength is a good general assessment of muscular strength, it may be recommended to include the isometric mid-thigh pull (IMTP), given its association with several other lower or total body strength measures (i.e., squat, deadlift, clean) and speed and jumping metrics. Again, there are affordable portable devices on the market.
Developing the Holistic Athlete
The final point, and perhaps the most important, is that performance in baseball (and most nearly all sports) goes beyond just the physical attributes and fitness metrics. Becoming a top-level baseball player requires a high proficiency in the sport-specific skills (hitting, throwing, fielding, pitching, base running), tactical understanding of the game/sports IQ and sound mental skills (concentration, resiliency, focus, relaxation under pressure etc). Furthermore, it requires the ability to stay fresh and fatigue resistant that necessitates a proper diet and sleep, and general rest and relaxation. Finally, young athletes need to develop in a fun and supportive environment.
To learn more about the USA Baseball Prospect Development Pipeline click here
To learn more about the USA Baseball National Team Identification Series click here
Click here to learn more about the USA Baseball 13U/14U and 16U/17U Athlete Development Program
Related articles


This is the exact gap we’re building VFIT to close, verified youth performance data instead of coach anecdote and radar-gun screenshots. The 12U-to-collegiate spread is where parents get burned, they fixate on one peak-power number and skip the development curve underneath it. Curious how large your 12U development-program sample is?